
안녕하세요. 오픈소스컨설팅에서 리눅스 엔지니어로 근무하고 있는 정광근 프로 입니다.
앞서 시스템 로그의 기본 구성을 파악하고, 설정하는 방법에 대해 알아보았습니다.
아직 못 보신 분들은 아래 페이지 먼저 참조하시면 시스템 로그 기본을 이해하시는데 많은 도움이 되실 겁니다.
로그 서버 구축 및 연동, 템플릿을 적용한 로그 파일 관리, 데이터베이스 연동, 이벤트 발생 시 모니터링을 통해 사용자에게 알릴 수 있는 알람 기능 등 시스템 로그를 다양하게 활용하는 방법에 대해 알아보도록 하겠습니다.
!. 인터넷에 나와있는 예제들을 그대로 사용하는 경우 성공 확률은 높지만 다양한 환경에 그대로 적용하기 어려운 경우가 많습니다.
운영할 때는 설정 값을 1도 안 바꾸지만, 테스트 할 땐 모든 설정 값을 바꾸는 싶어하는 저의 이상한 성격이 반영되어 -> 실무에서 원하시는 대로 사용하실 수 있도록 대부분의 설정을 customizing하여 다루었으며 그에 따라 발생한 TroubleShooting 내용도 쏠쏠하니 참고하시면서 보시면 좋을 것 같습니다.
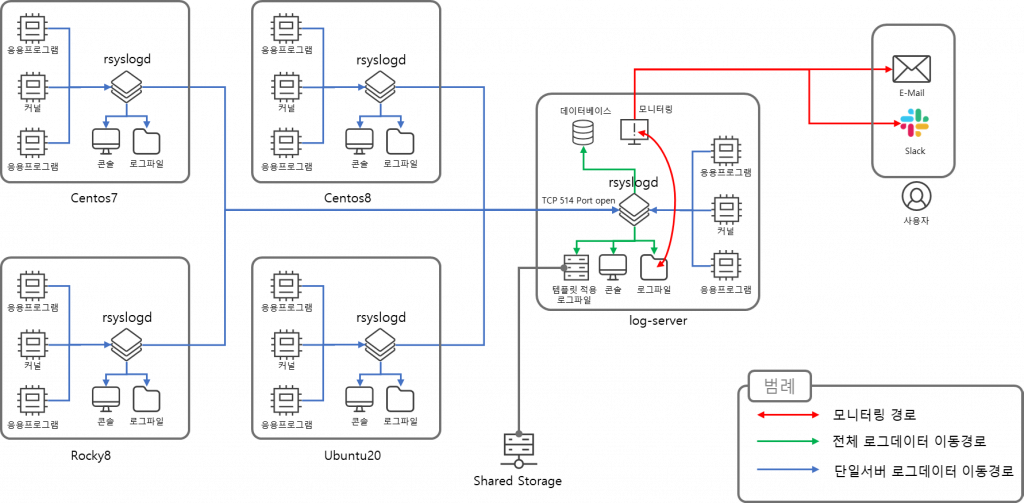
테스트 환경은 아래와 같습니다. 다양하게 구성한 이유는 이기종 OS간에도 로그 수집이 가능하다는 것을 보여주려는 것이 목적입니다.
| 용도 | OS | hostname | IP |
|---|---|---|---|
| Log Server | CentOS 7.9 | log-server | 172.20.10.21 |
| Client01 | CentOS 7.9 | centos7 | 172.20.10.22 |
| Client02 | CentOS 8.5 | centos8 | 172.20.10.23 |
| Client03 | Rocky 8.5 | rocky8 | 172.20.10.24 |
| Client04 | Ubuntu20.04 | ubuntu20 | 172.20.10.25 |
각각의 이기종 OS에서 발생되는 시스템 로그를 한 대의 로그 서버에서 취합하여 용도에 맞도록 저장하고 모니터링을 통해서 사용자에게 이벤트 메시지를 발송하는 내용까지 본문을 작성하는데 사용된 테스트 환경을 아래 구성도에 담아 봤습니다.
먼저 로그 서버를 구축하기 위해서는 rsyslog 패키지가 설치되어 있어야 합니다.
로그 서버를 구축하기 위한 설정 방법은 간단합니다.
설정 파일에서 로그를 받고자 하는 프로토콜에 해당되는 설정 값의 주석 체크를 해제한 다음 rsyslog 데몬을 재 기동하면 됩니다.
프로토콜은 TCP와 UDP 두 가지로 구성되어 있고, 설정 파일에서 UDP 프로토콜은 15~16 라인, TCP 프로토콜은 19,20 라인의 주석을 해제한 후 데몬 재 기동을 하면 로그 서버로서의 기본적인 역할을 수행합니다.
저는 데이터 전송의 정확성을 고려하여 TCP 프로토콜을 사용하도록 설정해 보았습니다. 포트 넘버는 정체성의 혼돈이 생길 수 있어 변경하지 않았습니다.
[root@log-server ~]# vi /etc/rsyslog.conf
=================================================
# TCP로 로그를 전송받기 위해 아래 19,20 라인의 주석을 해제해 줍니다.
 14 # Provides UDP syslog reception
 15 #$ModLoad imudp
 16 #$UDPServerRun 514
 17
 18 # Provides TCP syslog reception
 19 #$ModLoad imtcp
 20 #$InputTCPServerRun 514
-------------------------------------------------
 14 # Provides UDP syslog reception
 15 #$ModLoad imudp
 16 #$UDPServerRun 514
 17
 18 # Provides TCP syslog reception
 19 $ModLoad imtcp
 20 $InputTCPServerRun 514
방화벽을 사용하고 있는 경우 TCP 514 포트에 대해 방화벽 정책을 열어준 후 다시 로드해 줍니다.
[root@log-server ~]# firewall-cmd --add-port=514/tcp --zone=public --permanent

[root@log-server ~]# firewall-cmd --reload클라이언트에서 로그 서버로 데이터를 전송하는 방법은 Action 값에 로그 서버의 IP주소를 넣어주면 됩니다.
테스트에 사용된 OS 환경은 제각각이지만 클라이언트의 설정 값은 아래와 같이 동일합니다.
설정 값을 풀어보면 서버에서 발생되는 모든 로그 정보를 로그 서버의 514 포트로 TCP 프로토콜을 사용하여 보내는 것을 의미합니다. @ 두개는 TCP, 한개는 UDP 송신을 뜻하며, 콜론(:) 뒤의 값은 전송 포트를 의미합니다. 로그 서버에서 포트를 변경하여 사용하는 경우 이 부분을 수정해 주면 됩니다.
또한 일부 정보만 보내고 싶은 경우 * 대신 원하는 facility, priority를 넣어주면 됩니다.
root@ubuntu20:~# vi /etc/rsyslog.conf

*.* @@172.20.10.21:514로그 서버를 구성한다는 것은 다양한 서버의 로그 데이터를 받는 다는 것이고, 서버 수가 많아질수록 복잡해 지기 때문에 이를 구별하는 것이 필요합니다.
서버의 hostname을 기준으로 로그 파일을 저장할 수 있도록 템플릿 적용하는 방법을 알아 보도록 하겠습니다.
템플릿 형태는 다음과 같이 변수와 디렉토리 풀 경로를 지정해 주고 해당 변수에 설정할 facility, priority값을 적용해주면 됩니다.
$template <변수>,"<디렉토리 풀경로(파일명포함)>"
facility, priority ?<변수>
템플릿에 적용되어 실제로 저장될 로그 파일명은 구별이 잘 될 수 있도록 커스터마이징 해서 사용하면 됩니다.
아래 설정 값은 제가 원하는 방식으로 구성하였으며, 각 서버의 시스템 로그를 hostname으로 분류하여 1일 단위로 특정 디렉토리에 저장되도록 설정 하였습니다.
[root@log-server ~]# vi /etc/rsyslog.conf
$template SysMsg,"/data/%fromhost%_messages-%$YEAR%-%$MONTH%-%$DAY%.log"
$template SysSecu,"/data/%fromhost%_secure-%$YEAR%-%$MONTH%-%$DAY%.log"
$template SysMail,"/data/%fromhost%_maillog-%$YEAR%-%$MONTH%-%$DAY%.log"
$template SysCron,"/data/%fromhost%_cron-%$YEAR%-%$MONTH%-%$DAY%.log"
$template SysLocal,"/data/%fromhost%_boot-%$YEAR%-%$MONTH%-%$DAY%.log"

*.info;mail.none;authpriv.none;cron.none ?SysMsg
authpriv.* ?SysSecu
mail.* ?SysMail
cron.* ?SysCron

local7.* ?SysLocal기존 /var/log/ 디렉토리에 신규로 로그 파일이 생성되도록 테스트 했을 때에는 잘 생성 되었는데 위 템플릿 처럼 특정 디렉토리를 지정하니 해당 디렉토리에 로그 파일이 생성되지 않았습니다.
이 글을 보시는 대다수의 운영자 분들은 특정 디렉토리에 마운트 된 공유 스토리지에 저장하는 것을 원하실 것이므로 디렉토리 변경이 가능하도록 트러블 슈팅을 좀 해보겠습니다.
먼저 살펴볼 내용은 디렉토리 권한인데 문제는 없었습니다. 방화벽을 살펴보아도 문제가 없고, 해당 포트도 떠있는데 생성이 되지 않았습니다.
로그 서버의 시스템 로그를 살펴 보겠습니다.
[root@log-server ~]# tail -f /var/log/messages
Jul 18 02:49:50 test23 rsyslogd: file '/data/127.0.0.1_messages_2022-07-18.log': open error: Permission denied [v8.24.0-55.el7 try http://www.rsyslog.com/e/2433  ]
Jul 18 02:49:50 test23 rsyslogd: file '/data/127.0.0.1_messages_2022-07-18.log': open error: Permission denied [v8.24.0-55.el7 try http://www.rsyslog.com/e/2433  ]
Jul 18 02:49:50 test23 rsyslogd: file '/data/127.0.0.1_messages_2022-07-18.log': open error: Permission denied [v8.24.0-55.el7 try http://www.rsyslog.com/e/2433  ]
Jul 18 02:49:50 test23 rsyslogd: file '/data/127.0.0.1_messages_2022-07-18.log': open error: Permission denied [v8.24.0-55.el7 try http://www.rsyslog.com/e/2433  ]
Jul 18 02:49:50 test23 rsyslogd: file '/data/127.0.0.1_messages_2022-07-18.log': open error: Permission denied [v8.24.0-55.el7 try http://www.rsyslog.com/e/2433  ]
Jul 18 02:49:50 test23 rsyslogd: file '/data/127.0.0.1_messages_2022-07-18.log': open error: Permission denied [v8.24.0-55.el7 try http://www.rsyslog.com/e/2433  ]

Jul 18 02:49:50 test23 rsyslogd: file '/data/127.0.0.1_messages_2022-07-18.log': open error: Permission denied [v8.24.0-55.el7 try http://www.rsyslog.com/e/2433  ]
권한 문제로 open error가 발생하였는데, 폴더 권한은 기존 /var/log/ 디렉토리와 동일하므로 추가로 selinux를 건드려 보겠습니다.
selinux가 Enforcing 상태라 Permissive로 변경 하여 테스트 해 보았더니 로그 파일이 정상적으로 생성 되었습니다. fcontext 와 관련이 있을 것으로 예상됩니다.
일단 지금은 selinux 시간이 아니기 때문에 selinux를 사용하는 환경에서도 특정 디렉토리에 파일이 생성될 수 있는 방법만 알아 보도록 하겠습니다.
설정 파일에 파일이나 폴더 생성과 연관된 권한 부분을 추가해 줍니다.
(저의 경우 /var/log/ 디렉토리에 저장된 로그 파일과 동일하게 0600 권한으로 파일이 생성되도록 작업하였습니다)
[root@log-server ~]# vi /etc/rsyslog.conf
$FileCreateMode 0640
$DirCreateMode 0755

$Umask 0044
이제 로그가 잘 쌓이는 것을 볼 수 있습니다.
[root@log-server data]# ll
-rw-------. 1 root root  1574 Jul 18 04:39 log-server_messages_2022-07-18.log
-rw-------. 1 root root   254 Jul 18 04:30 172.20.10.22_cron_2022-07-18.log
-rw-------. 1 root root   198 Jul 18 04:26 172.20.10.22_maillog_2022-07-18.log
-rw-------. 1 root root 62317 Jul 18 04:30 172.20.10.22_messages_2022-07-18.log
-rw-------. 1 root root   956 Jul 18 04:27 172.20.10.22_secure_2022-07-18.log
-rw-------. 1 root root   332 Jul 18 04:27 172.20.10.23_cron_2022-07-18.log
-rw-------. 1 root root  5297 Jul 18 04:28 172.20.10.24_messages_2022-07-18.log
-rw-------. 1 root root   169 Jul 18 04:30 172.20.10.25_cron_2022-07-18.log
-rw-------. 1 root root  3156 Jul 18 04:31 172.20.10.25_messages_2022-07-18.log

-rw-------. 1 root root 456 Jul 18 04:30 172.20.10.25_secure_2022-07-18.log여기서 특이한 점이 또 보입니다. log-server는 hostname을 정상적으로 받아오는데 다른 서버들의 정보는 IP 정보로 표현이 됩니다.
아마도 로그 서버에서 클라이언트의 hostname 정보를 알고 있지 않기 때문에 발생한 것으로 보입니다.
이런 경우 당황하지 말고 로그 서버의 호스트 파일에 클라이언트 리스트를 추가해 주면 됩니다.
[root@log-server ~]# cat /etc/hosts
127.0.0.1   localhost localhost.localdomain localhost4 localhost4.localdomain4
::1         localhost localhost.localdomain localhost6 localhost6.localdomain6
172.20.10.21	log-server
172.20.10.22	centos7
172.20.10.23	centos8
172.20.10.24	rocky8

172.20.10.25 ubuntu20생각해보니 서버를 디렉토리 단위로 구분 지어 놓으면 관리하기 용이할 것 같습니다. 로그 파일이 디렉토리별로 저장될 수 있도록 설정 내용을 변경해 줍니다.
[root@log-server ~]# vi /etc/rsyslog.conf
$template SysMsg,"/data/%fromhost%/messages-%$YEAR%%$MONTH%%$DAY%.log"
$template SysSecu,"/data/%fromhost%/secure-%$YEAR%%$MONTH%%$DAY%.log"
$template SysMail,"/data/%fromhost%/maillog-%$YEAR%%$MONTH%%$DAY%.log"
$template SysCron,"/data/%fromhost%/cron-%$YEAR%%$MONTH%%$DAY%.log"
$template SysLocal,"/data/%fromhost%/boot-%$YEAR%%$MONTH%%$DAY%.log"

*.info;mail.none;authpriv.none;cron.none ?SysMsg
authpriv.* ?SysSecu
mail.* ?SysMail
cron.* ?SysCron

local7.* ?SysLocal
데몬을 재 시작 한 후 확인해 보니 서버의 hostname별로 잘 구분되어 저장되는 것을 확인할 수 있었습니다.
[root@log-server data]# systemctl restart rsyslog
[root@log-server data]# ls -l
total 0
drwx------. 2 root root 115 Jul 18 05:12 centos7
drwx------. 2 root root  87 Jul 18 05:12 centos8
drwx------. 2 root root 115 Jul 18 05:13 log-server
drwx------. 2 root root  87 Jul 18 05:12 rocky8
drwx------. 2 root root  87 Jul 18 05:13 ubuntu20

[root@log-server data]# ls -l *
centos7:
total 76
-rw-------. 1 root root   254 Jul 18 05:12 cron-20220718.log
-rw-------. 1 root root   198 Jul 18 05:12 maillog-20220718.log
-rw-------. 1 root root 61562 Jul 18 05:13 messages-20220718.log
-rw-------. 1 root root   958 Jul 18 05:13 secure-20220718.log

centos8:
total 76
-rw-------. 1 root root   618 Jul 18 05:12 cron-20220718.log
-rw-------. 1 root root 67760 Jul 18 05:13 messages-20220718.log
-rw-------. 1 root root   818 Jul 18 05:13 secure-20220718.log

log-server:
total 72
-rw-------. 1 root root   187 Jul 18 05:13 cron-20220718.log
-rw-------. 1 root root   200 Jul 18 05:13 maillog-20220718.log
-rw-------. 1 root root 60107 Jul 18 05:13 messages-20220718.log
-rw-------. 1 root root   731 Jul 18 05:13 secure-20220718.log

rocky8:
total 392
-rw-------. 1 root root    332 Jul 18 05:12 cron-20220718.log
-rw-------. 1 root root 132772 Jul 18 05:13 messages-20220718.log
-rw-------. 1 root root   1361 Jul 18 05:13 secure-20220718.log

ubuntu20:
total 36
-rw-------. 1 root root   125 Jul 18 05:13 cron-20220718.log
-rw-------. 1 root root 28060 Jul 18 05:13 messages-20220718.log

-rw-------. 1 root root 438 Jul 18 05:12 secure-20220718.log로그 파일 보관을 위한 목적이라면 지금까지 알아본 것처럼 파일 단위로 보관하는 것이 직관적이고 관리하기 용이합니다.
하지만 장기간 쌓인 로그에서 문자열이나 특이 패턴 등을 검색해 볼 일이 많아질 경우 얘기가 좀 달라질 수 있습니다.
이러한 경우에는 DB에 데이터를 저장하여 검색하는 것이 원하는 값을 추출하기 수월하고 작업 시간도 많이 줄일 수 있습니다. 그래서 이번에는 시스템 로그를 DB에 저장하는 방법에 대해 알아보겠습니다.
DBMS(Database Management System)로는 MariaDB를 사용합니다.
설치 방법은 소스 파일을 가져와서 컴파일하는 방법, 컴파일 된 바이너리 파일을 사용하는 방법, rpm 패키지를 사용하는 방법 등 다양한 방법으로 설치할 수 있습니다. 결국 MariaDB만 설치되어 있다면 된다는 얘기 입니다.
본문에서는 로그 서버 구축이 목적이니 만큼 가장 손이 덜 가고 가장 쉬운 방법인 rpm 패키지를 사용하는 방법으로 진행하겠습니다.
mariadb-server 패키지를 설치합니다. 저의 경우 36개의 Dependency 패키지가 추가로 설치 되었습니다.
[root@log-server ~]# yum install mariadb-server
Installed:
  mariadb-server.x86_64 1:5.5.68-1.el7

Dependency Installed:
  mariadb.x86_64 1:5.5.68-1.el7               perl.x86_64 4:5.16.3-299.el7_9       perl-Carp.noarch 0:1.26-244.el7          perl-Compress-Raw-Bzip2.x86_64 0:2.061-3.el7
  perl-Compress-Raw-Zlib.x86_64 1:2.061-4.el7 perl-DBD-MySQL.x86_64 0:4.023-6.el7  perl-DBI.x86_64 0:1.627-4.el7            perl-Data-Dumper.x86_64 0:2.145-3.el7
  perl-Encode.x86_64 0:2.51-7.el7             perl-Exporter.noarch 0:5.68-3.el7    perl-File-Path.noarch 0:2.09-2.el7       perl-File-Temp.noarch 0:0.23.01-3.el7
  perl-Filter.x86_64 0:1.49-3.el7             perl-Getopt-Long.noarch 0:2.40-3.el7 perl-HTTP-Tiny.noarch 0:0.033-3.el7      perl-IO-Compress.noarch 0:2.061-2.el7
  perl-Net-Daemon.noarch 0:0.48-5.el7         perl-PathTools.x86_64 0:3.40-5.el7   perl-PlRPC.noarch 0:0.2020-14.el7        perl-Pod-Escapes.noarch 1:1.04-299.el7_9
  perl-Pod-Perldoc.noarch 0:3.20-4.el7        perl-Pod-Simple.noarch 1:3.28-4.el7  perl-Pod-Usage.noarch 0:1.63-3.el7       perl-Scalar-List-Utils.x86_64 0:1.27-248.el7
  perl-Socket.x86_64 0:2.010-5.el7            perl-Storable.x86_64 0:2.45-3.el7    perl-Text-ParseWords.noarch 0:3.29-4.el7 perl-Time-HiRes.x86_64 4:1.9725-3.el7
  perl-Time-Local.noarch 0:1.2300-2.el7       perl-constant.noarch 0:1.27-2.el7    perl-libs.x86_64 4:5.16.3-299.el7_9      perl-macros.x86_64 4:5.16.3-299.el7_9
  perl-parent.noarch 1:0.225-244.el7          perl-podlators.noarch 0:2.5.1-3.el7  perl-threads.x86_64 0:1.87-4.el7         perl-threads-shared.x86_64 0:1.43-6.el7


Complete!
MariaDB 기동 및 자동 시작을 한번에 설정해 줍니다.
[root@log-server ~]# systemctl enable mariadb --now
Created symlink from /etc/systemd/system/multi-user.target.wants/mariadb.service to /usr/lib/systemd/system/mariadb.service.
이제 데이터를 MariaDB에 저장하기 위해 필요한 syslog-mysql 패키지를 설치합니다.
[root@log-server ~]# yum install rsyslog-mysql
Installed:
rsyslog-mysql.x86_64 0:8.24.0-57.el7_9.3

Dependency Updated:
rsyslog.x86_64 0:8.24.0-57.el7_9.3


Complete!
syslog-mysql 설치 시 rsyslog도 의존성 영향을 받아 업데이트 될 수 있는데요. 이때 동작 중이던 rsyslog 데몬은 자동으로 재 기동 되니 이점 유의하시기 바랍니다.
아래 상태 체크 결과 중 ’17s ago’ 부분을 보면 재 기동 된 사실을 확인할 수 있습니다.
[root@log-server ~]# systemctl status rsyslog
● rsyslog.service - System Logging Service
Loaded: loaded (/usr/lib/systemd/system/rsyslog.service; enabled; vendor preset: enabled)
Active: active (running) since Tue 2022-07-19 03:42:17 EDT; 17s ago
Docs: man:rsyslogd(8)
http://www.rsyslog.com/doc/
Main PID: 4598 (rsyslogd)
CGroup: /system.slice/rsyslog.service
└─4598 /usr/sbin/rsyslogd -n

Jul 19 03:42:17 log-server systemd[1]: Stopped System Logging Service.
Jul 19 03:42:17 log-server systemd[1]: Starting System Logging Service...
Jul 19 03:42:17 log-server rsyslogd[4598]:  [origin software="rsyslogd" swVersion="8.24.0-57.el7_9.3" x-pid="4598" x-info="http://www.rsyslog.com"] start

Jul 19 03:42:17 log-server systemd[1]: Started System Logging Service.먼저 MariaDB초기 설치 후 root 계정에 대해 패스워드 설정을 해줍니다.
저는 test로 패스워드를 설정 하였으며, 접속이 잘 되는 것을 아래와 같이 확인 할 수 있습니다.
[root@log-server ~]# mysql
Welcome to the MariaDB monitor.  Commands end with ; or \g.
Your MariaDB connection id is 12
Server version: 5.5.68-MariaDB MariaDB Server

Copyright (c) 2000, 2018, Oracle, MariaDB Corporation Ab and others.

Type 'help;' or '\h' for help. Type '\c' to clear the current input statement.

MariaDB [(none)]> use mysql;
Reading table information for completion of table and column names
You can turn off this feature to get a quicker startup with -A

Database changed
MariaDB [mysql]> update user set password = password('test') where user = 'root';
Query OK, 4 rows affected (0.00 sec)
Rows matched: 4  Changed: 4  Warnings: 0

MariaDB [mysql]>  flush privileges;
Query OK, 0 rows affected (0.00 sec)

MariaDB [mysql]> exit
Bye
[root@log-server rsyslog-8.24.0]# mysql -uroot -ptest
Welcome to the MariaDB monitor.  Commands end with ; or \g.
Your MariaDB connection id is 14
Server version: 5.5.68-MariaDB MariaDB Server

Copyright (c) 2000, 2018, Oracle, MariaDB Corporation Ab and others.

Type 'help;' or '\h' for help. Type '\c' to clear the current input statement.


MariaDB [(none)]> syslog-mysql 패키지를 설치하면 /usr/share/doc/rsyslog-8.24.0 디렉토리 하위에 mysql-createDB.sql 라는 파일이 생성됩니다. 해당 파일을 사용하여 syslog가 저장될 database와 table을 쉽게 만들 수 있습니다.
원본파일의 경우 database명은 Syslog이고 , tables명은 SystemEvents과 SystemEventsProperties입니다.
저는 원본 그대로 적용 하는 것을 좋아하지 않는 이상한 성격을 가지고 있기 때문에 파일명을 test-createDB.sql 로 변경해보고 database명과 table명도 아래와 같이 변경해서 생성해 보겠습니다.
[root@log-server rsyslog-8.24.0]# cat /usr/share/doc/rsyslog-8.24.0/test-createDB.sql
CREATE DATABASE osci_logserver;
USE Syslog;
CREATE TABLE osci_manage_events
(
        ID int unsigned not null auto_increment primary key,
        CustomerID bigint,
        ReceivedAt datetime NULL,
        DeviceReportedTime datetime NULL,
        Facility smallint NULL,
        Priority smallint NULL,
        FromHost varchar(60) NULL,
        Message text,
        NTSeverity int NULL,
        Importance int NULL,
        EventSource varchar(60),
        EventUser varchar(60) NULL,
        EventCategory int NULL,
        EventID int NULL,
        EventBinaryData text NULL,
        MaxAvailable int NULL,
        CurrUsage int NULL,
        MinUsage int NULL,
        MaxUsage int NULL,
        InfoUnitID int NULL ,
        SysLogTag varchar(60),
        EventLogType varchar(60),
        GenericFileName VarChar(60),
        SystemID int NULL
);

CREATE TABLE osci_manage_eventsProperties
(
        ID int unsigned not null auto_increment primary key,
        SystemEventID int NULL ,
        ParamName varchar(255) NULL ,
        ParamValue text NULL

);
이제 database와 table을 만들어 보겠습니다. 1049에러가 났습니다. MariaDB도 트러블슈팅을 한번 해보겠습니다.
[root@log-server rsyslog-8.24.0]# mysql -uroot -ptest  < /usr/share/doc/rsyslog-8.24.0/test-createDB.sql

ERROR 1049 (42000) at line 2: Unknown database 'Syslog'
이럴 땐 웹사이트에서 해당 에러 넘버를 검색해보면 답을 찾을 수 있지만 사전 테스트에서는 정상적으로 생성되었기 때문에 제가 변경한 내용을 다시 한번 보겠습니다.
Syslog라는 database를 찾을 수 없다는 부분을 보면 table을 만들기 전에 생성할 database를 선택하는 부분인 USE Syslog; → USE osci_logserver; 이 부분을 수정하지 못해 일어난 결과인 것 같습니다. 이 부분도 변경된 database로 수정해 보겠습니다.
[root@log-server rsyslog-8.24.0]# cat /usr/share/doc/rsyslog-8.24.0/test-createDB.sql
CREATE DATABASE osci_logserver;
USE osci_logserver;
CREATE TABLE osci_manage_events
(
        ID int unsigned not null auto_increment primary key,
        CustomerID bigint,
        ReceivedAt datetime NULL,
        DeviceReportedTime datetime NULL,
        Facility smallint NULL,
        Priority smallint NULL,
        FromHost varchar(60) NULL,
        Message text,
        NTSeverity int NULL,
        Importance int NULL,
        EventSource varchar(60),
        EventUser varchar(60) NULL,
        EventCategory int NULL,
        EventID int NULL,
        EventBinaryData text NULL,
        MaxAvailable int NULL,
        CurrUsage int NULL,
        MinUsage int NULL,
        MaxUsage int NULL,
        InfoUnitID int NULL ,
        SysLogTag varchar(60),
        EventLogType varchar(60),
        GenericFileName VarChar(60),
        SystemID int NULL
);

CREATE TABLE osci_manage_eventsProperties
(
        ID int unsigned not null auto_increment primary key,
        SystemEventID int NULL ,
        ParamName varchar(255) NULL ,
        ParamValue text NULL

);
다시 시도해 보겠습니다. 이번에는 1007에러가 발생하였고 database가 이미 존재한다는 내용입니다.
방금 전에 database를 만든 이후 에러가 발생하였기 때문에 database는 그 명령어 수행으로 생성되었던 것 같습니다.
[root@log-server rsyslog-8.24.0]# mysql -uroot -ptest  < /usr/share/doc/rsyslog-8.24.0/test-createDB.sql

ERROR 1007 (HY000) at line 1: Can't create database 'test_logserver'; database exists
MariaDB에 접속하여 해당 database를 삭제해 보겠습니다.
[root@log-server rsyslog-8.24.0]# mysql -uroot -ptest
Welcome to the MariaDB monitor.  Commands end with ; or \g.
Your MariaDB connection id is 21
Server version: 5.5.68-MariaDB MariaDB Server

Copyright (c) 2000, 2018, Oracle, MariaDB Corporation Ab and others.

Type 'help;' or '\h' for help. Type '\c' to clear the current input statement.

MariaDB [(none)]> show databases;
+--------------------+
| Database           |
+--------------------+
| information_schema |
| mysql              |
| performance_schema |
| test_logserver     |
+--------------------+
4 rows in set (0.00 sec)

MariaDB [(none)]> drop database test_logserver;
Query OK, 0 rows affected (0.00 sec)

MariaDB [(none)]> show databases;
+--------------------+
| Database           |
+--------------------+
| information_schema |
| mysql              |
| performance_schema |
+--------------------+
3 rows in set (0.01 sec)


MariaDB [(none)]>
삭제는 잘 되었고 다시 시도해 보겠습니다. 이번에는 원하던 database와 table이 잘 생성 되었습니다.
[root@log-server ~]# mysql -uroot -ptest  < /usr/share/doc/rsyslog-8.24.0/test-createDB.sql
[root@log-server rsyslog-8.24.0]# mysql -uroot -ptest
Welcome to the MariaDB monitor.  Commands end with ; or \g.
Your MariaDB connection id is 23
Server version: 5.5.68-MariaDB MariaDB Server

Copyright (c) 2000, 2018, Oracle, MariaDB Corporation Ab and others.

Type 'help;' or '\h' for help. Type '\c' to clear the current input statement.

MariaDB [(none)]> show databases;
+--------------------+
| Database           |
+--------------------+
| information_schema |
| mysql              |
| osci_logserver     |
| performance_schema |
+--------------------+
4 rows in set (0.00 sec)

MariaDB [(none)]> use test_logserver;
Reading table information for completion of table and column names
You can turn off this feature to get a quicker startup with -A

Database changed
MariaDB [test_logserver]> show tables;
+------------------------------+
| Tables_in_osci_logserver     |
+------------------------------+
| osci_manage_events           |
| osci_manage_eventsProperties |
+------------------------------+
2 rows in set (0.00 sec)


MariaDB [test_logserver]> rsyslog와 연동할 osci 라는 계정을 생성하고 로그를 저장할 database에서 사용할 수 있도록 권한을 줍니다. 마지막에 flush privileges 해주지 않으면 설정된 내용이 적용되지 않아 로그가 저장되지 않을 수 있으니 주의해야 합니다. (저도 빼 먹어서 로그가 쌓이지 않았습니다)
MariaDB [osci_logserver]> create user 'osci'@'localhost' identified by 'test';
Query OK, 0 rows affected (0.01 sec)

MariaDB [osci_logserver]> grant all privileges on osci_logserver.* to 'osci'@'localhost';
Query OK, 0 rows affected (0.00 sec)

MariaDB [(none)]> flush privileges;

Query OK, 0 rows affected (0.00 sec)이제 rsyslog 설정 파일에서 database와 연동될 수 있도록 설정 값을 추가해 보겠습니다.
아래와 같은 양식으로 작성하면 됩니다.
$ModLoad ommysql
$ActionOmmysqlServerPort <database port>

<facility.priority> :ommysql:<주소>,<database명>,<DB계정>,<DB계정 패스워드>
제가 구성한 정보들을 참조하여 아래와 같이 작성해 보았습니다.
$ModLoad ommysql
$ActionOmmysqlServerPort 3306
*.* :ommysql:127.0.0.1,osci_logserver,osci,test
해당 설정 값 적용 후 데몬 재 기동하였으나 시간이 지나도 database에 값이 들어오지 않아 트러블 슈팅을 해보겠습니다.
시스템 로그를 보니 osci_logserver라는 database에 SystemEvents라는 table이 존재하지 않아 1146에러가 발생한 것으로 보입니다.
변경된 database는 인식이 된 것으로 보이는데 table명은 SystemEvents라는 기본값으로 어딘가에 명시되어 있나 봅니다. 찾아보고 변경을 하여 사용할 수도 있겠지만 시간이 오래 걸릴 것 같아 우회해 보겠습니다.
[root@log-server ~]# vi /var/log/messages
Jul 20 03:01:01 log-server rsyslogd: action 'action 7' resumed (module 'ommysql') [v8.24.0-57.el7_9.3 try http://www.rsyslog.com/e/2359 ]
Jul 20 03:01:01 log-server rsyslogd: db error (1146): Table 'osci_logserver.SystemEvents' doesn't exist  [v8.24.0-57.el7_9.3]
일단 변경된 database명과 table명을 사용할 수 있기만 한다면 문제는 없을 것 같으니 table명도 명시할 수 있는 템플릿 형태로 적용해 보겠습니다. 아래와 같이 적용 시켜주니 로그가 잘 들어왔습니다.
[root@log-server ~]# vi /etc/rsyslog.conf
$ModLoad ommysql
$ActionOmmysqlServerPort 3306
$template db_tem1,"insert into osci_manage_events (Message, Facility, FromHost, Priority, DeviceReportedTime, ReceivedAt, InfoUnitID, SysLogTag) values ('%msg%', %syslogfacility%, '%FROMHOST%', %syslogpriority%, '%timereported:::date-mysql%', '%timegenerated:::date-mysql%', %iut%, '%syslogtag%')",SQL
*.* :ommysql:127.0.0.1,osci_logserver,osci,test;db_tem1

#kern.* :ommysql:127.0.0.1,osci_kern_events,osci,test
저는 커널 로그만 따로 관리하고 싶어 커널 정보만 저장할 수 있는 osci_kern_log라는 이름의 database를 추가로 생성해 보았습니다. 두 개 이상의 database를 구성할 수도 있다는 것을 확인해 보고 싶기도 했습니다.
MariaDB [osci_logserver]> show databases;
+--------------------+
| Database           |
+--------------------+
| information_schema |
| mysql              |
| osci_kern_log      |
| osci_logserver     |
| performance_schema |
+--------------------+
5 rows in set (0.00 sec)

MariaDB [osci_logserver]> use osci_kern_log
Reading table information for completion of table and column names
You can turn off this feature to get a quicker startup with -A

Database changed
MariaDB [osci_kern_log]> show tables;
+----------------------------+
| Tables_in_osci_kern_log    |
+----------------------------+
| osci_kern_events           |
| osci_kern_eventsProperties |
+----------------------------+
2 rows in set (0.00 sec)


MariaDB [osci_kern_log]>
그리고 커널 정보만 MariaDB에 전달할 수 있도록 설정 파일에 템플릿을 적용하여 아래 두 줄을 추가해 주었습니다.
[root@log-server data]# vi /etc/rsyslog.conf
$template db_tem2,"insert into osci_kern_events (Message, Facility, FromHost, Priority, DeviceReportedTime, ReceivedAt, InfoUnitID, SysLogTag) values ('%msg%', %syslogfacility%, '%FROMHOST%', %syslogpriority%, '%timereported:::date-mysql%', '%timegenerated:::date-mysql%', %iut%, '%syslogtag%')",SQL

kern.* :ommysql:127.0.0.1,osci_kern_log,osci,test;db_tem2
MariaDB에서는 osci계정이 커널을 저장할 database에 접근할 수 있도록 권한도 주었습니다.
MariaDB [osci_logserver]> grant all privileges on osci_kern_log.* to 'osci'@'localhost';
Query OK, 0 rows affected (0.00 sec)

MariaDB [(none)]> flush privileges;

Query OK, 0 rows affected (0.00 sec)일정 시간이 지난 후 구성한 두 개의 database에 로그가 잘 들어오고 있다는 것을 쿼리문으로 확인 할 수 있었습니다.
MariaDB [(none)]> use osci_logserver
Reading table information for completion of table and column names
You can turn off this feature to get a quicker startup with -A

Database changed
MariaDB [osci_logserver]> select count(*) from osci_manage_events;
+----------+
| count(*) |
+----------+
|    10702 |
+----------+
1 row in set (0.01 sec)

MariaDB [osci_logserver]> use osci_kern_log
Reading table information for completion of table and column names
You can turn off this feature to get a quicker startup with -A

Database changed
MariaDB [osci_kern_log]> select count(*) from osci_kern_events;
+----------+
| count(*) |
+----------+
|     2098 |
+----------+
1 row in set (0.00 sec)


MariaDB [osci_kern_log]>
저런 내용을 확인하기 위해 MariaDB 접속하는 방법이 귀찮으신 분들은 아래와 같이 접속하지 않아도 쉽게 확인할 수 있는 방법이 있으니 편의에 맞게 사용하시면 됩니다.
[root@log-server ~]#  echo "select count(*) from osci_manage_events;" | mysql osci_logserver -u root -ptest
count(*)
10702
[root@log-server ~]# echo "select count(*) from osci_kern_events;" | mysql osci_kern_log -u root -ptest
count(*)

2098
이제 저는 원하는 내용의 로그만 뽑을 수가 있습니다. 천군만마를 얻은 것 같네요.
MariaDB [osci_kern_log]> select * from osci_kern_events where FromHost = 'centos8' limit 3\G;
*************************** 1. row ***************************
                ID: 498
        CustomerID: NULL
        ReceivedAt: 2022-07-20 03:42:16
DeviceReportedTime: 2022-07-20 03:42:16
          Facility: 0
          Priority: 4
          FromHost: centos8
           Message:  hv_balloon: Balloon request will be partially fulfilled. Not enough memory.
        NTSeverity: NULL
        Importance: NULL
       EventSource: NULL
         EventUser: NULL
     EventCategory: NULL
           EventID: NULL
   EventBinaryData: NULL
      MaxAvailable: NULL
         CurrUsage: NULL
          MinUsage: NULL
          MaxUsage: NULL
        InfoUnitID: 1
         SysLogTag: kernel:
      EventLogType: NULL
   GenericFileName: NULL
          SystemID: NULL
*************************** 2. row ***************************
                ID: 499
        CustomerID: NULL
        ReceivedAt: 2022-07-20 03:47:16
DeviceReportedTime: 2022-07-20 03:47:16
          Facility: 0
          Priority: 4
          FromHost: centos8
           Message:  hv_balloon: Balloon request will be partially fulfilled. Not enough memory.
        NTSeverity: NULL
        Importance: NULL
       EventSource: NULL
         EventUser: NULL
     EventCategory: NULL
           EventID: NULL
   EventBinaryData: NULL
      MaxAvailable: NULL
         CurrUsage: NULL
          MinUsage: NULL
          MaxUsage: NULL
        InfoUnitID: 1
         SysLogTag: kernel:
      EventLogType: NULL
   GenericFileName: NULL
          SystemID: NULL
*************************** 3. row ***************************
                ID: 500
        CustomerID: NULL
        ReceivedAt: 2022-07-20 03:52:16
DeviceReportedTime: 2022-07-20 03:52:16
          Facility: 0
          Priority: 4
          FromHost: centos8
           Message:  hv_balloon: Balloon request will be partially fulfilled. Not enough memory.
        NTSeverity: NULL
        Importance: NULL
       EventSource: NULL
         EventUser: NULL
     EventCategory: NULL
           EventID: NULL
   EventBinaryData: NULL
      MaxAvailable: NULL
         CurrUsage: NULL
          MinUsage: NULL
          MaxUsage: NULL
        InfoUnitID: 1
         SysLogTag: kernel:
      EventLogType: NULL
   GenericFileName: NULL
          SystemID: NULL
3 rows in set (0.00 sec)
and 연산자를 통해 특정 호스트에서 원하는 이슈만 뽑아낼 수도 있습니다.
MariaDB [osci_logserver]> select * from osci_manage_events where message regexp 'critical|error|warn|alert|fault|fail' and fromhost='centos8' limit 4\G;
*************************** 1. row ***************************
                ID: 26
        CustomerID: NULL
        ReceivedAt: 2022-07-20 03:32:16
DeviceReportedTime: 2022-07-20 03:32:16
          Facility: 5
          Priority: 3
          FromHost: centos8
           Message:  omfwd: remote server at 172.20.10.21:514 seems to have closed connection. This often happens when the remote peer (or an interim system like a load balancer or firewall) shuts down or aborts a connection. Rsyslog will re-open the connection if configured to do so (we saw a generic IO Error, which usually goes along with that behaviour). [v8.2102.0-5.el8 try https://www.rsyslog.com/e/2027 ]
        NTSeverity: NULL
        Importance: NULL
       EventSource: NULL
         EventUser: NULL
     EventCategory: NULL
           EventID: NULL
   EventBinaryData: NULL
      MaxAvailable: NULL
         CurrUsage: NULL
          MinUsage: NULL
          MaxUsage: NULL
        InfoUnitID: 1
         SysLogTag: rsyslogd[1080]:
      EventLogType: NULL
   GenericFileName: NULL
          SystemID: NULL
*************************** 2. row ***************************
                ID: 992
        CustomerID: NULL
        ReceivedAt: 2022-07-20 03:37:16
DeviceReportedTime: 2022-07-20 03:37:16
          Facility: 5
          Priority: 3
          FromHost: centos8
           Message:  omfwd: remote server at 172.20.10.21:514 seems to have closed connection. This often happens when the remote peer (or an interim system like a load balancer or firewall) shuts down or aborts a connection. Rsyslog will re-open the connection if configured to do so (we saw a generic IO Error, which usually goes along with that behaviour). [v8.2102.0-5.el8 try https://www.rsyslog.com/e/2027 ]
        NTSeverity: NULL
        Importance: NULL
       EventSource: NULL
         EventUser: NULL
     EventCategory: NULL
           EventID: NULL
   EventBinaryData: NULL
      MaxAvailable: NULL
         CurrUsage: NULL
          MinUsage: NULL
          MaxUsage: NULL
        InfoUnitID: 1
         SysLogTag: rsyslogd[1080]:
      EventLogType: NULL
   GenericFileName: NULL
          SystemID: NULL
*************************** 3. row ***************************
                ID: 2243
        CustomerID: NULL
        ReceivedAt: 2022-07-20 03:42:16
DeviceReportedTime: 2022-07-20 03:42:16
          Facility: 5
          Priority: 3
          FromHost: centos8
           Message:  omfwd: remote server at 172.20.10.21:514 seems to have closed connection. This often happens when the remote peer (or an interim system like a load balancer or firewall) shuts down or aborts a connection. Rsyslog will re-open the connection if configured to do so (we saw a generic IO Error, which usually goes along with that behaviour). [v8.2102.0-5.el8 try https://www.rsyslog.com/e/2027 ]
        NTSeverity: NULL
        Importance: NULL
       EventSource: NULL
         EventUser: NULL
     EventCategory: NULL
           EventID: NULL
   EventBinaryData: NULL
      MaxAvailable: NULL
         CurrUsage: NULL
          MinUsage: NULL
          MaxUsage: NULL
        InfoUnitID: 1
         SysLogTag: rsyslogd[1080]:
      EventLogType: NULL
   GenericFileName: NULL
          SystemID: NULL
*************************** 4. row ***************************
                ID: 3379
        CustomerID: NULL
        ReceivedAt: 2022-07-20 05:19:14
DeviceReportedTime: 2022-07-20 05:19:14
          Facility: 3
          Priority: 6
          FromHost: centos8
           Message:  Stopped target Default.
        NTSeverity: NULL
        Importance: NULL
       EventSource: NULL
         EventUser: NULL
     EventCategory: NULL
           EventID: NULL
   EventBinaryData: NULL
      MaxAvailable: NULL
         CurrUsage: NULL
          MinUsage: NULL
          MaxUsage: NULL
        InfoUnitID: 1
         SysLogTag: systemd[1513]:
      EventLogType: NULL
   GenericFileName: NULL
          SystemID: NULL
4 rows in set (0.01 sec)

ERROR: No query specified
여기서 중요한 점은 MariaDB에 저장도 하면서도 서버에 로컬 파일로도 로그를 보관할 수도 있다는 점입니다.
이렇게 설정만 잘 되어 있다면 양방향 로그 보관이 가능하니 상황에 맞게 설정하여 관리하면 업무에 많은 도움이 될 것입니다.
이제 마지막으로 발생한 이벤트에 대해 어떻게 모니터링을 할 것이며 알람은 또 어떻게 보낼 것인지 알아볼 시간입니다.
로그 서버의 시스템 로그 설정에서 기본 설정 값을 건드리지 않는다면 로그 서버의 시스템 로그에는 클라이언트의 모든 로그가 같이 적용되어 기록이 됩니다.
다시 말해서 템플릿을 통해 생성한 파일은 /data 디렉토리에 로그 파일로 저장되고 기본 시스템 로그가 저장되는 /var/log 디렉토리에도 모든 서버의 로그가 통합으로 쌓이게 됩니다.
통합으로 쌓이는 로그 파일만 스크립트로 체크해 준다면 단일 파일을 모니터링하여 모든 서버의 이슈를 확인할 수 있기 때문에 간단하게 구성해 볼 수 있을 것 같습니다.
저는 1분 단위로 /var/log/messages 파일을 체크하여 1분 전에 이슈가 발생하였는지 파악하여 발생한 메시지를 E-Mail과 슬랙(slack)으로 전달 할 수 있도록 스크립트를 작성해 보았습니다.
업계에서 사용하는 모니터링 툴 처럼 10초나 30초 단위로 쪼개서 확인하고자 한다면 cron의 최소 단위가 1분이니 스크립트를 하나 더 생성하여 해당 스크립트에서 모니터링 스크립트를 10초 간격으로 수행할 수 있도록 하면 될 것 같습니다.
스크립트를 1개로 사용하고자 한다면 for문과 sleep 타임을 주어서 적용 시켜도 되겠네요.
모니터링 결과 전송은 E-mail과 슬랙으로 보내도록 하겠습니다.
슬랙을 선정한 이유로는 최근 많은 기업에서 사용하고 있고 저희 회사에서도 사용 중인 도구여서 접근이 쉬울 것 같았습니다.
경험상 사무실에서는 물론이고 이동 중에도 접근성이 용이하기 때문에 모니터링 알람 서비스로 적절해 보였으며, 메시지를 전달하는 API를 제공하기 때문에 이러한 작업이 가능하기도 했습니다.
슬랙에서 메시지를 전달 받기 위해서는 먼저 슬랙 홈페이지에 접속한 후 메뉴에서 리소스 > 개발자 항목으로 들어가면 slack api 사이트가 나옵니다. 링크 —> https://api.slack.com/apps
여기서 slack API 중에 Webhook(웹훅)이라는 녀석을 사용할 겁니다.
웹훅이란 특정 행동으로 인해 발생한 이벤트들을 커스텀 callback으로 변환해주는 방법입니다. 쉽게 말해 역방향 API 라고도 하며 서버에서 클라이언트로 호출하는 방식입니다.
미리 메시지를 받을 주소인 Callback URL을 정해 놓고 서버에서 이벤트가 발생하면 Callback URL에 메시지를 보내 웹훅 핸들러가 엔드 포인트로 메시지를 전달하는 방식입니다. 이때 Callback URL로 정보를 보내는 방식은 HTTP POST 방식을 사용하게 됩니다.
아래 절차를 진행 해보고 다시 얘기 나눠보도록 하겠습니다.
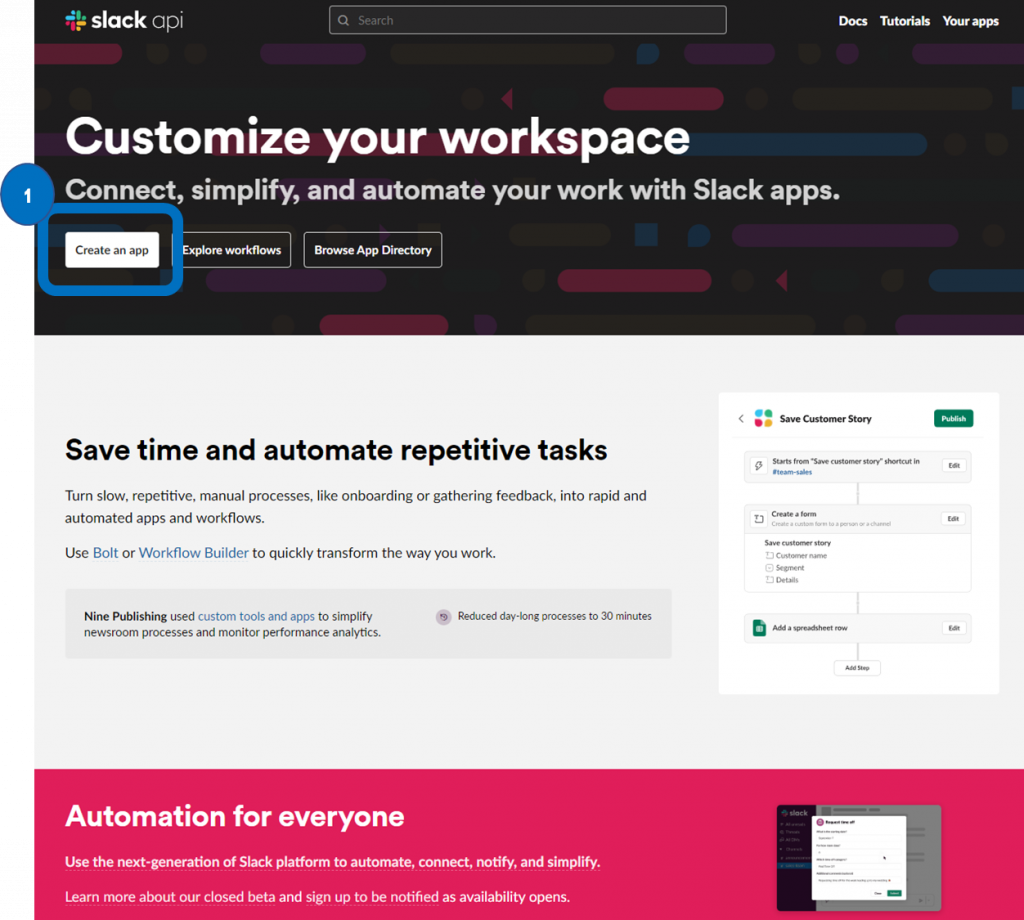
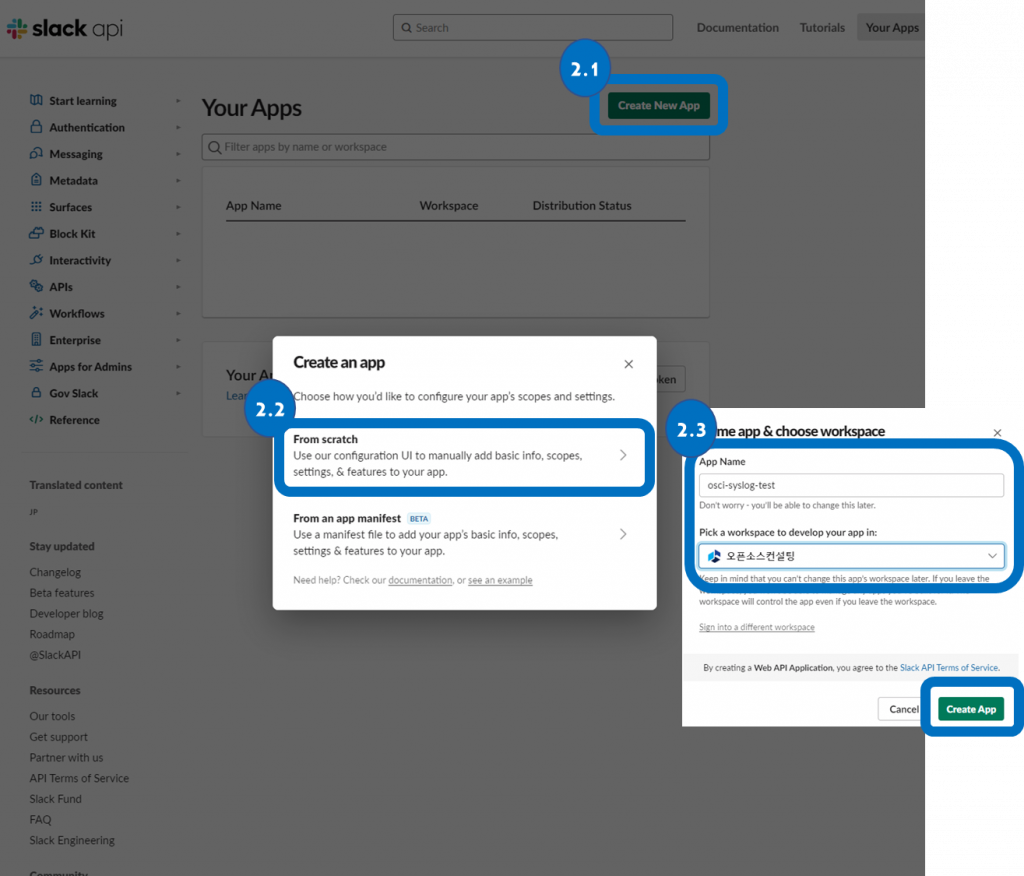
2.1 Create New App 선택
2.2 From scratch 선택
2.3 App Name 작성 / workspace 선택
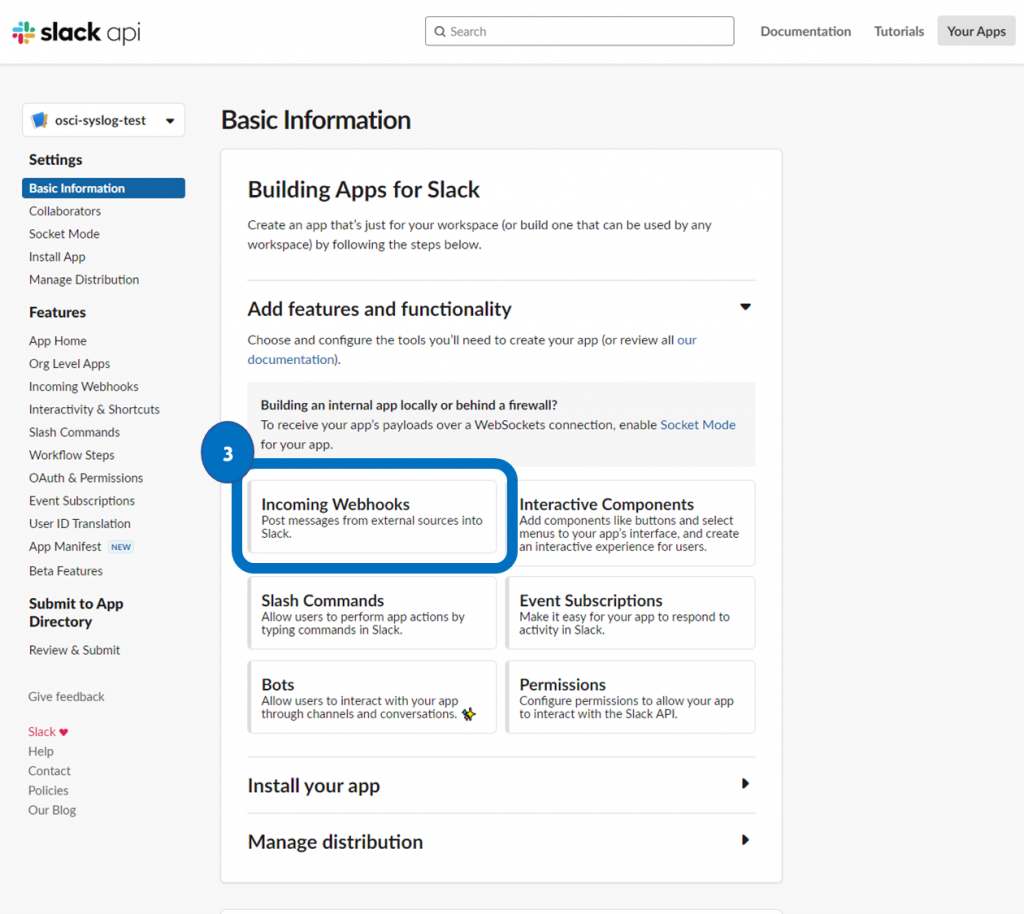
3. Incoming Webhooks 선택
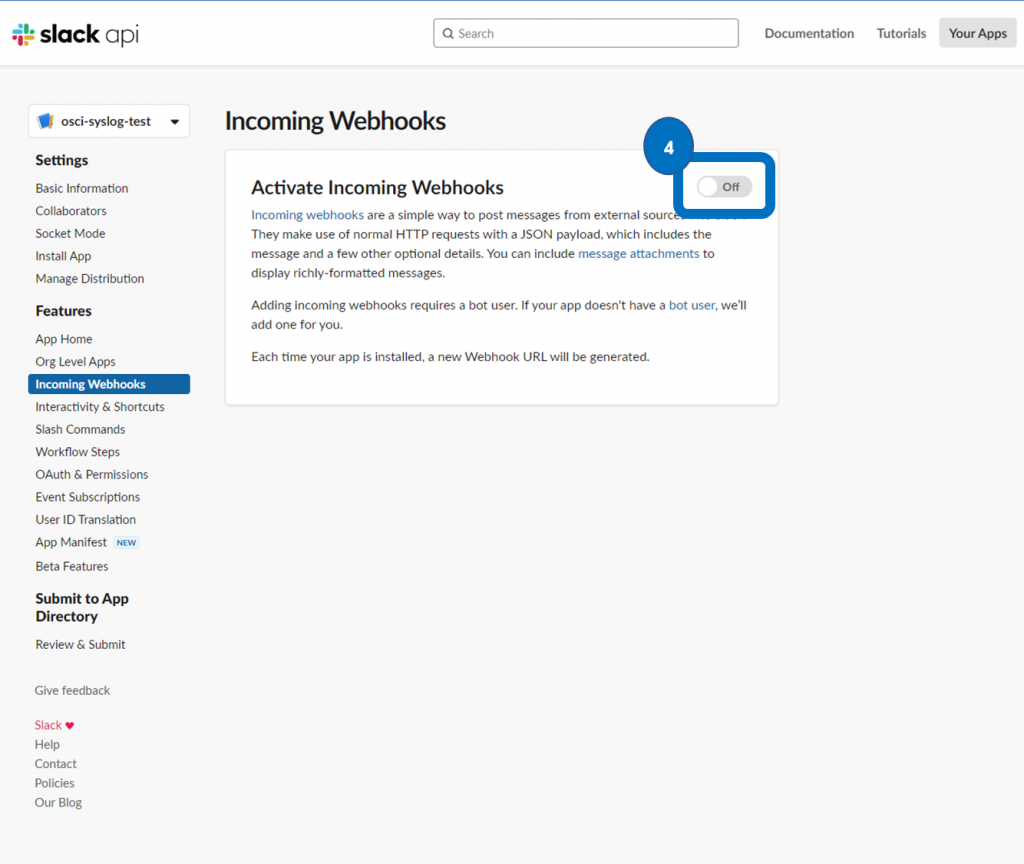
4. Activate Incoming Webhooks oiff → on으로 변경
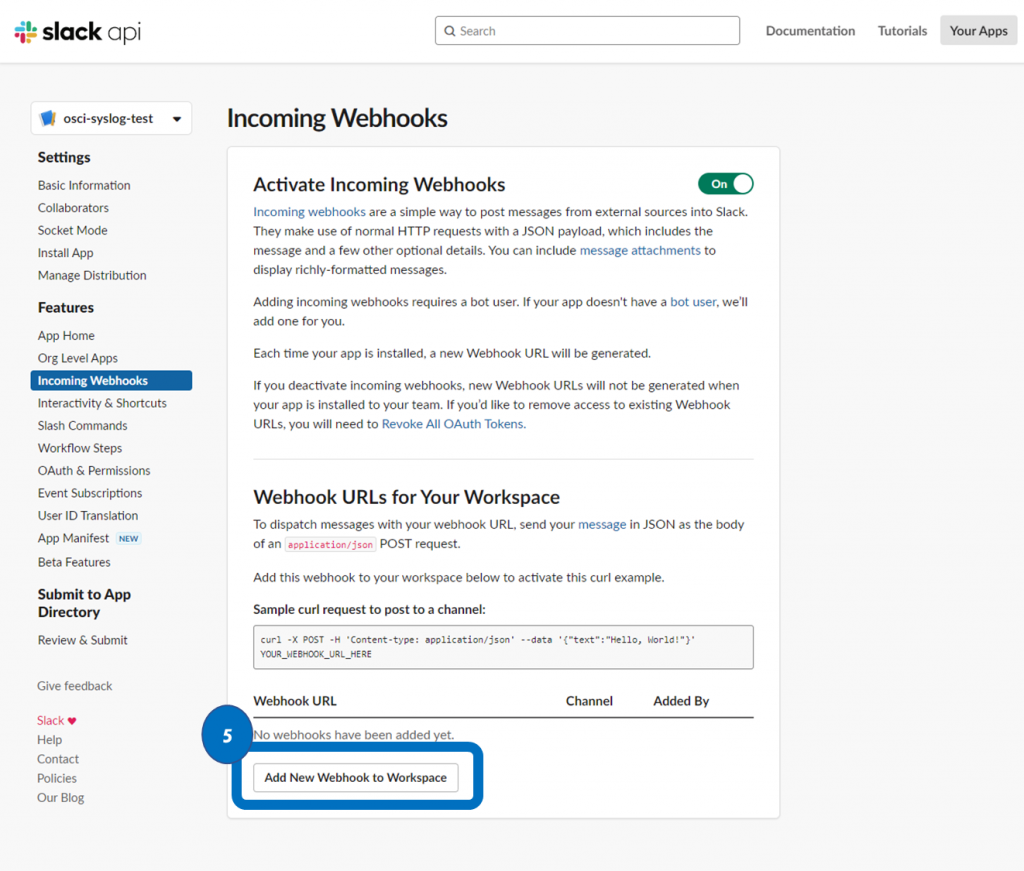
5. Add New Webhook to Workspace 선택
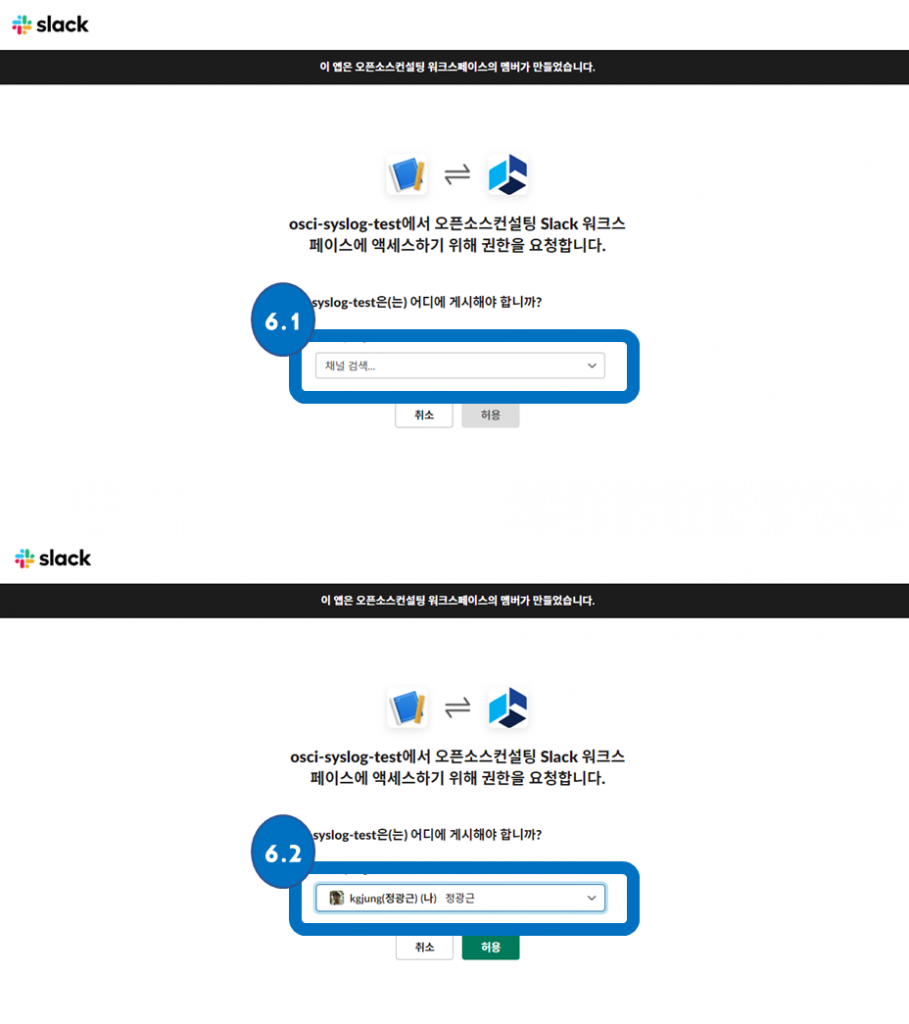
6.1 채널검색
6.2 채널이나 다이렉트 메시지 선택(개인 다이렉트 메시지로 선택하였습니다)
7. Sample curl request to post to a channel의 curl 예제를 복사하여 사용
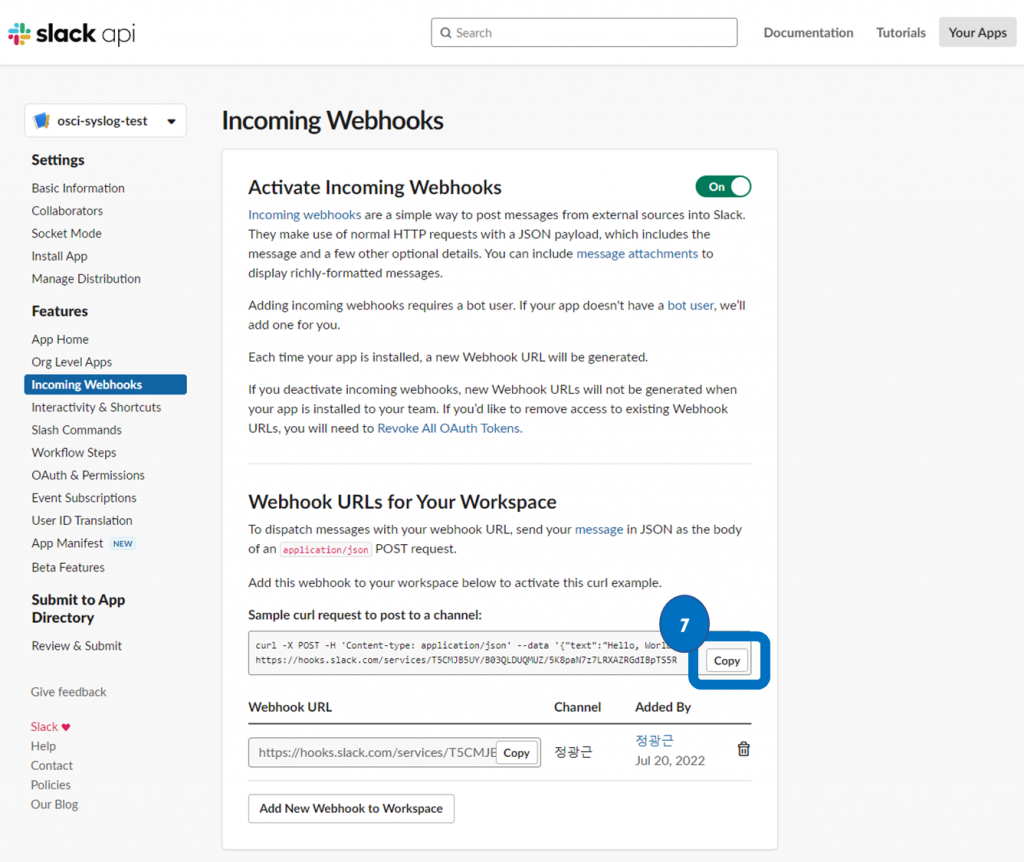
슬랙을 기준으로 보았을 때 서버에서 curl 명령어를 수행하여 Callback URL에 메시지를 보내면 Callback URL을 가진 App(핸들러)이 지정한 엔드 포인트(DM 또는 채널)로 메시지를 전달하는 방식으로 진행된다고 해석할 수 있을 것 같습니다.
copy한 Callback URL에 텍스트 내용을 바꿔서 메시지를 보내도록 해보겠습니다. 커맨드 라인에는 ok가 떨어졌고, 슬랙에도 메시지가 잘 도착 했습니다. 생각 보다 어렵지는 않네요.
[root@log-server ~]# curl -X POST -H 'Content-type: application/json' --data '{"text":"시스로그 이벤트를 전달해 봅니다."}' https://hooks.slack.com/services/T5CMJB5UY/B03QL

ok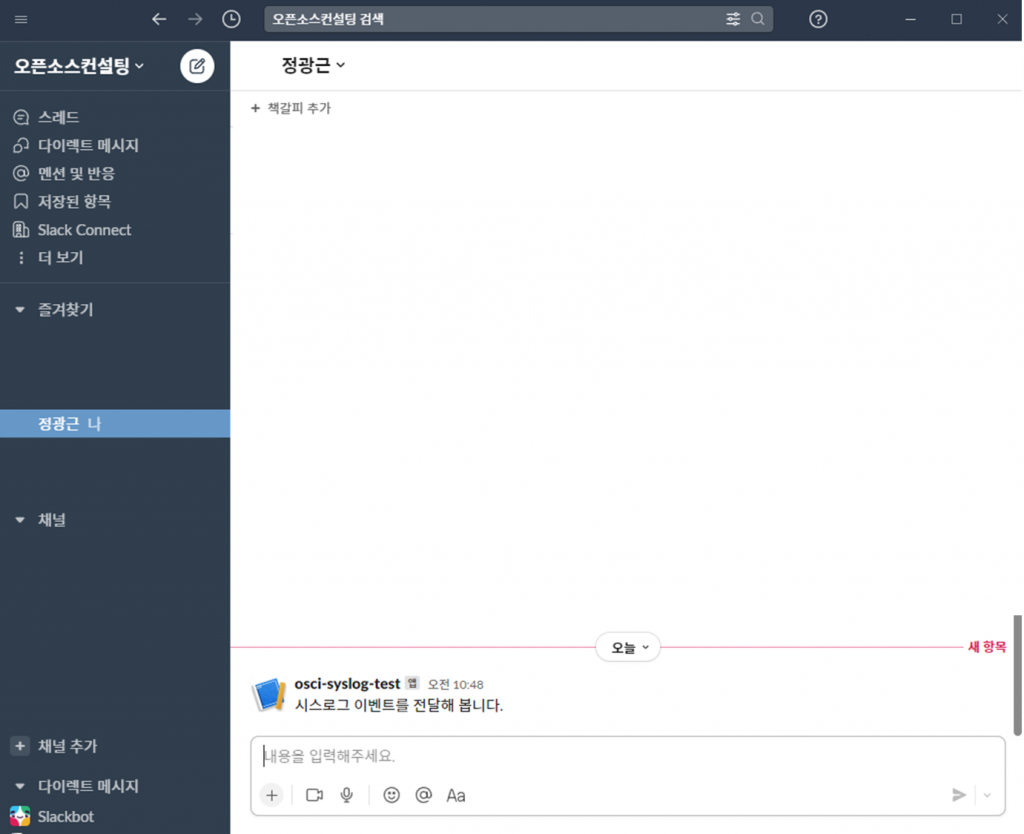
이제 이메일을 보내볼 차례입니다.
먼저 mailx가 설치되어 있는지 확인 후 없으면 yum으로 설치해 줍니다.
[root@log-server ~]# yum install mailx
=========================================================================================================================================================
 Package                            Arch                                Version                                  Repository                         Size
=========================================================================================================================================================
Installing:
 mailx                              x86_64                              12.5-19.el7                              base                              245 k
Transaction Summary
=========================================================================================================================================================

Install  1 Package
바이너리 파일이 설치 되었는지 확인해 봅니다. 잘 설치 되었네요.
[root@log-server ~]# ll /bin/mail

lrwxrwxrwx. 1 root root 5 Jul 20 21:59 /bin/mail -> mailx
회사 메일 계정으로 테스트 메일을 보내 보겠습니다.
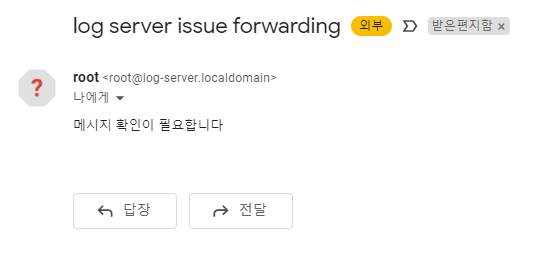
[root@log-server ~]# echo "메시지 확인이 필요합니다" | /bin/mail -s "log server issue forwarding" "kgjung@osci.kr"
이벤트 메일은 잘 도착했습니다. 이제 슬랙과 메일에 메시지를 보내기 위한 사전 준비는 끝났습니다.
스크립트를 작성하여 cron으로 1분마다 동작하도록 설정하였습니다.
[root@log-server ~]# cat /root/test.sh
#!/bin/bash
DATE=`date '+%b %e %H:%M' -d '1 minutes ago'`
MSG=`cat /var/log/messages | grep "$DATE" | egrep -i "critical|error|warn|alert|fault|fail"`
MSG1=`cat /var/log/messages | grep "$DATE" | egrep -i "critical|error|warn|alert|fault|fail" | wc -l`
MON_LOG=/opt/monitor.log
TO_EMAIL="kgjung@osci.kr"
HOSTNAME=`hostname -f`
SUBJECT="[${HOSTNAME}] 로그에 이상이 감지되었습니다. 관리자의 확인이 필요합니다"
if [ $MSG1 = "0" ]; then
echo "이상없음" >> $MON_LOG;
else
curl -X POST -H 'Content-type: application/json' --data "{\"text\":\"$MSG\"}" https://hooks.slack.com/services/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;
echo "$MSG" | /bin/mail -s "$SUBJECT" "$TO_EMAIL";
fi
[root@log-server ~]# crontab -l
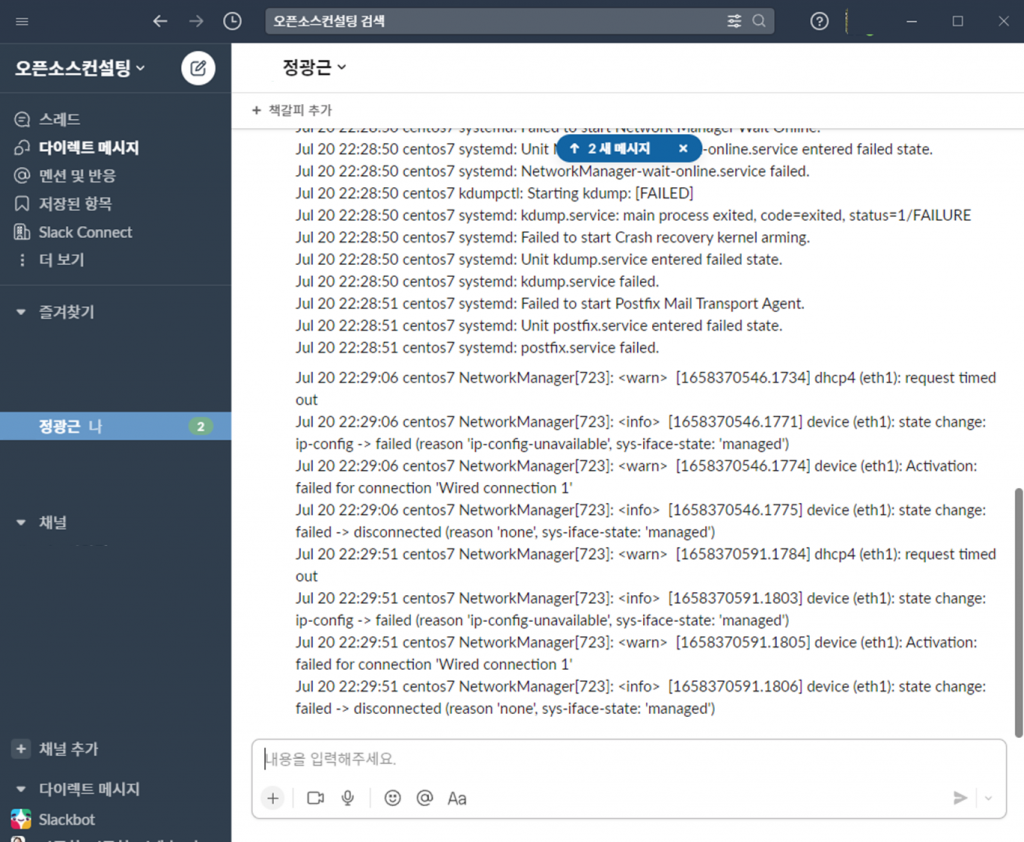
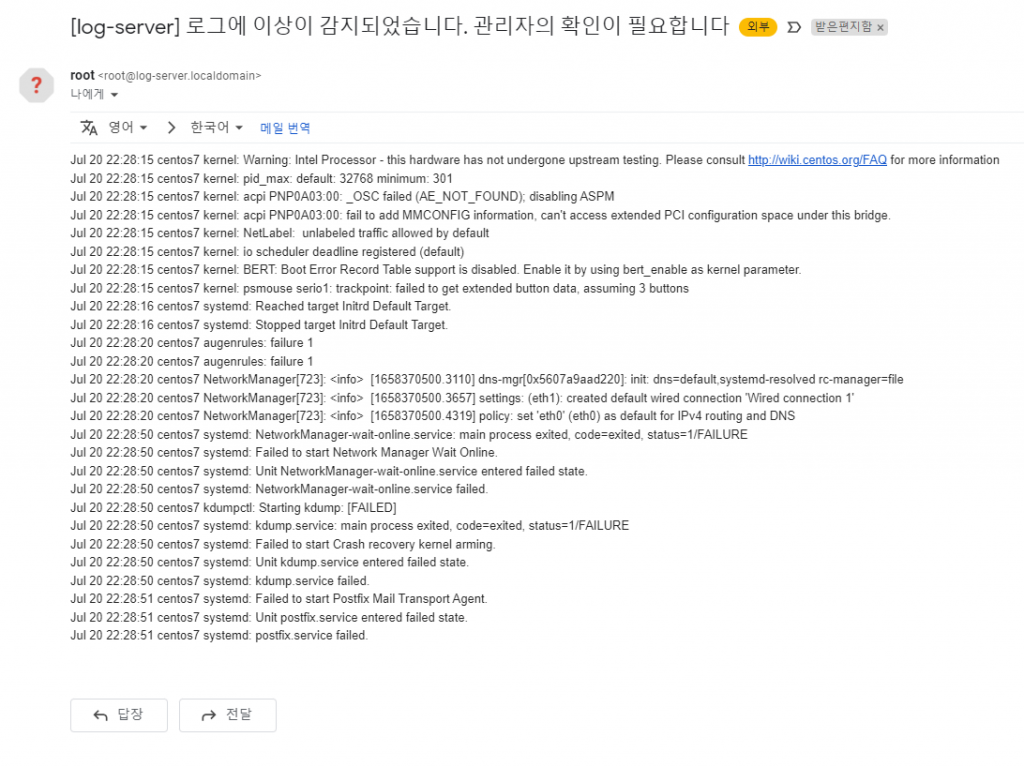
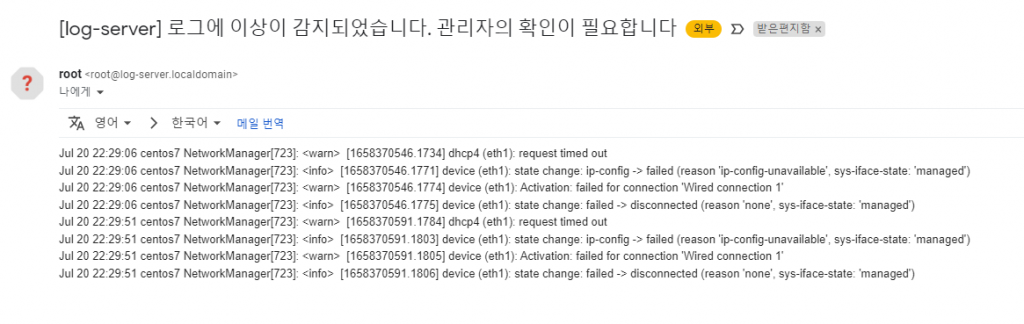
* * * * * /root/test.sh클라이언트인 centos7 서버를 리부팅 한 뒤 1분 후에 알람이 오는지 확인해 보도록 하겠습니다.
[root@centos7 ~]# reboot
Connection closing...Socket close.

Connection closed by foreign host.
슬랙과 메일로 알람이 계속 오고 있습니다. 설정은 잘 된 것 같습니다.
마치며…
이렇게 로그 서버 구축 / 연동 / 템플릿 적용 / DB 연동 / 슬랙 및 E-Mail을 통한 이벤트 알람 전송 등 다양하게 활용하는 방법에 대해 알아보았습니다.
본문에서는 로그를 통합 관리하는 방법에 대해 다루었지만 더불어 각각의 클라이언트 서버에서도 logrotate와 같은 작업을 수행하여 체계적으로 로그 파일 슬라이싱과 압축을 해주면 더 탄탄한 로그 파일 관리 체계가 이루어 질 것입니다.
시스템 로그를 변경하고 로그 서버를 구성하는 작업을 진행하면서 한번에 동작하지 않은 부분은 여럿 있었지만 구성하기에 난이도가 높은 편은 아니었습니다.
본문 내용을 잘 참고하셔서 입맛대로 설정하고 상황에 맞게 관리하여 보다 더 나은 업무 환경이 되시길 바랍니다.
참고 사이트